Linear Regression with and without numpy
The most fundamental, and among the oldest, method of statistical inference is linear regression. The basic idea is to fit a set of observations to a slope and intercept and then use the implicit line to make predictions about unobserved data. Although it's considered statistically basic, it's still a useful tool for a lot of real-world cases, and at least an interesting stopping point on the way to more advanced statistical inference techniques.
Given a set n of observations yk against an independent variable xk, it's unlikely that you're going to find a slope m and an intercept b that match the data exactly, even if there is an actual linear relationship between x and y. Consider the three points in figure 1, for example:
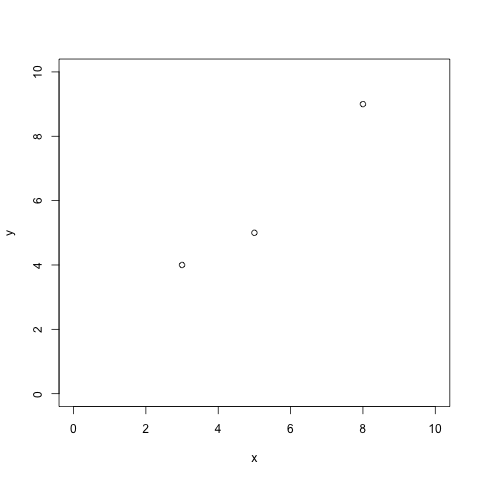
Figure 1: three observed points
You can't fit a line directly to these three points. (You can fit a parabola, but you wouldn't be able to with four or more points). Intuitively, though, there must be a single line that is closer to these three points than any other line. This line may well not actually touch any of the points themselves while still being the line that "fits" the observations best. So, if you did know the slope and the intercept of that line, you could measure the distance of each point to that line and "score" it. Working backwards, then, the goal is to find the line whose score is the best: the one whose distances is smallest. As it turns out, a tractable way to approach this problem is to minimize the squares of the differences between the best-fit line and the observed data.
So, the "best fit" line is found by minimizing the function: $$f(m,b)=\sum_{k=1}^n(y_k-mx_k-b)^2$$ The partial derivative with respect to b is: $$\frac{\partial f}{\partial b} = \sum_{k=1}^n-2y_k+2mx_k+2b$$ And the partial derivative with respect to m is: $$\frac{\partial f}{\partial m} = \sum_{k=1}^n-2x_ky_k+2x_kb+2mx_k^2$$
If you're not familiar with partial derivatives, they're calculated like "full" derivatives, but treating every variable other than the target variable as if they were constants. (If you're not familiar with derivates at all... um, just take my word for it).
The best fit is minimized, then, when both partial derivatives equal 0. \(\frac{\partial f}{\partial b}\) equals 0 when: $$bn=\sum_{k=1}^ny_k-m\sum_{k=1}^nx_k$$ $$b=\bar{y}-m\bar{x}$$ Where \(\bar{y}\) and \(\bar{x}\) are the averages of \(y\) and \(x\), respectively. \(\frac{\partial f}{\partial m}\) equals 0 when: $$-2\sum_{k=1}^nx_ky_k+2b\sum_{k=1}^nx_k+2m\sum_{k=1}^nx_k^2=0$$ Substituting \(b\) into this equation yields: $$-2\sum_{k=1}^nx_ky_k+2(\bar{y}-m\bar{x})\sum_{k=1}^nx_k+2m\sum_{k=1}^nx_k^2=0$$ And solving for \(m\) results in: $$m=\frac{\sum{x_ky_k}-\bar{y}\sum{x_k}}{\sum{x_k^2}-\bar{x}\sum{x_k}}$$ $$m=\frac{\sum{x_ky_k-\bar{y}x_k}}{\sum{x_k^2-\bar{x}x_k}}$$ $$m=\frac{\sum{x_k(y_k-\bar{y})}}{\sum{x_k(x_k-\bar{x})}}$$
This lends itself to a straightforward Python implementation as shown in listing 1:
# Compute the average of a column of data
# df is a list of lists of floats, i is the index of the data within
# df to average.
def stats(df, i):
  ave = sum([l[i] for l in df]) / len(df)

  return ave

# df is a list of list of float values
# m is the slope of the line that best fits df, b is the y-intercept
def best_fit(df):
  ave_x = stats(df, 0)
  ave_y = stats(df, 1)
  m = sum([l[0] * (l[1] - ave_y) for l in df]) / sum([l[0] * (l[0] - ave_x) for l in df])
  b = ave_y - m * ave_x

  return (m, b)
Listing 1: Python linear regression
Here, the data is assumed to be in columnar format with x in the first column, y in the second. You can invoke this on the data from figure 1 as shown in listing 2:
best_fit([[3.0,4.0],[5.0,5.0],[8.0,9.0]])
Listing 2: Invoke best_fit
This yields a best-fit line with slope 0.526, and y-intercept 1.026. Of course, most people use numpy or scipy
to do this as shown in listing 3:
import numpy as np

x = np.array([3.0,5.0,8.0])
y = np.array([4.0,5.0,9.0])
A = np.vstack([x, np.ones(len(x))]).T   # keep numpy happy as it wants a 2-dimensional X parameter
np.linalg.lstsq(A, y, rcond=None)
Listing 3: numpy equivalent
numpy returns a tuple whose first parameter is an array containing the slope and intercept, and whose other elements
compute various statistics about the quality of the fit (the second parameter, for instance, is the RSS (Residual sum of squares)
value sum([(l[1] - m - (b * l[0])) ** 2 for l in df]); 0.657 in this case.
Add a comment:
Completely off-topic or spam comments will be removed at the discretion of the moderator.
You may preserve formatting (e.g. a code sample) by indenting with four spaces preceding the formatted line(s)