Using the Chrome Debugger Tools, part 3: The Sources Tab
A few months ago, I started putting together a series of tutorials on the
excellent Chrome debugger tools. Having explored the
Elements tab and the
Network tab, I'll continue to work
left-to-right and look this month at the Sources tab that functions
almost as a full-fledged in-browser IDE and is especially useful for Javascript
developers. I suspect that most users of the Chrome debugging tools started out
exploring the Source tab and discovered the rest of its
functionality later.
Source Level Breakpoints
At its simplest, the Sources tab allows you to set breakpoints and evaluate expressions in Javascript whether that Javascript was loaded from a separate file or was part of the page as illustrated in figure 1, below, which is a screen shot of the very simple Example 1.
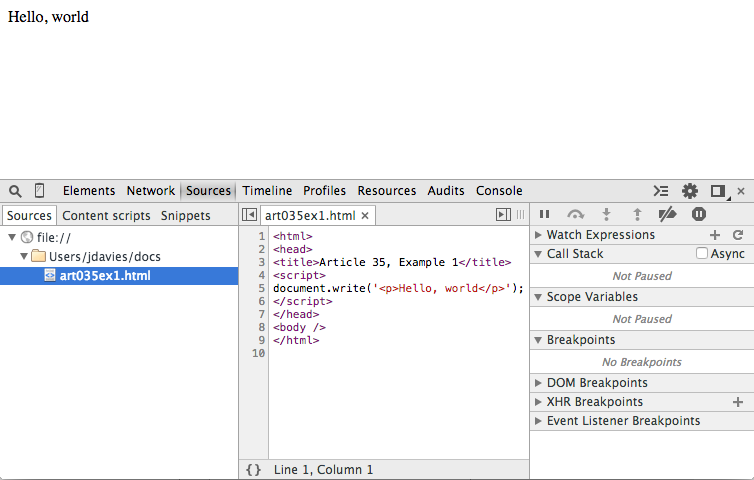
Figure 1: simple single-file web page
Figure 1 isn't very interesting because there's nothing going on; the page
has already been loaded. You can, of course, view the page source from here, but you can
see that in the Elements tab, with a nicer, pretty-printed view.
The Source tab has an edge over the Elements tab if the page includes any Javascript, though.
If you click the "gutter" next to the source listing where the line
numbers are, a blue chevron symbol appears, indicating that you have set a breakpoint.
If a breakpoint is set on the page, the browser will pause page
rendering when that piece of Javascript is executed. Since the single line of
Javascript in figure 1 is "inline" (that is, not contained inside a function),
it's executed as soon as it's parsed. Figure 2 demonstrates the browser view
if you set a breakpoint on line 5 and refresh the page.
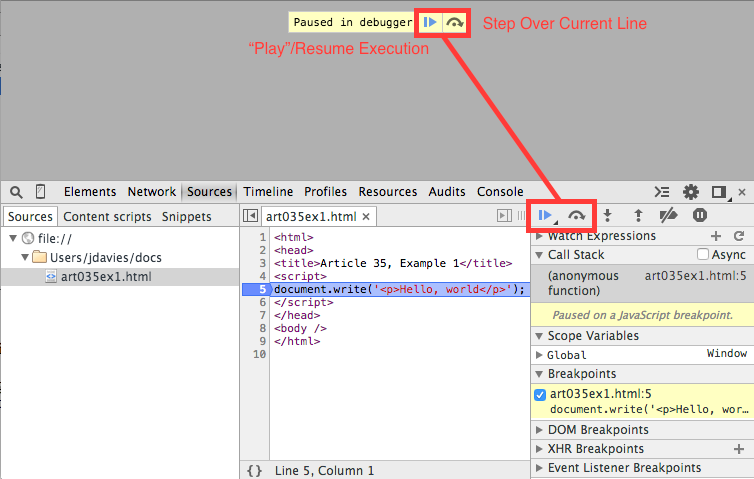
Figure 2: breaking on a line of Javascript
A few interesting points to observe about figure 2. First, the browser display
area is completely blank — the <body> tag hasn't been
encountered at this point, so the document doesn't have a body yet. The "loading"
icon in the upper-left corner of the browser (not shown in figure 2) continues to
spin as the page load is paused awaiting instruction. In this case, there's not
much interesting to do — but take a look at the tooltip along the top that says
"Paused in debugger". To the right of the text you see a right-pointing triangle and
an arrow. The first tells Chrome to finish loading the page (or continue to the
next breakpoint if one is encountered) and the second tells Chrome to run the highlighted
line and stop at the next one.
These same two icons are duplicated in the area to the right of the source listing, along with four others I'll discuss more below. For now, just press the resume triangle and let the page finish loading.
The Call Stack
Example 2 is a slightly more interesting page that computes
Fibonacci sequences (although the implementation is just a little bit contrived to show some of the
pieces of the debugger). Setting a breakpoint on line 9 and reloading as shown in figure 3 doesn't
cause anything to happen immediately, because the function fib isn't called until
you input a value for n and click the Compute button. (If you're following along, make sure to put a number in for n).
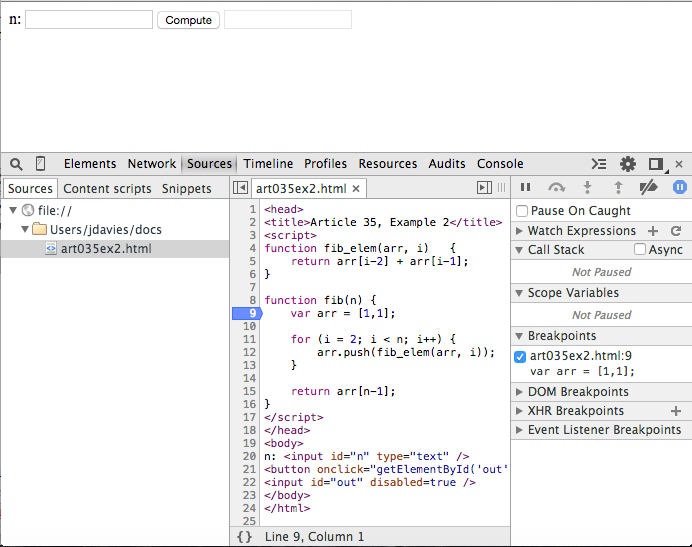
Figure 3: Fibonacci sequence
Now, when you input 8, to compute the 8th Fibonacci number (which is 21) and click
Compute, the browser pauses as shown in figure 4.
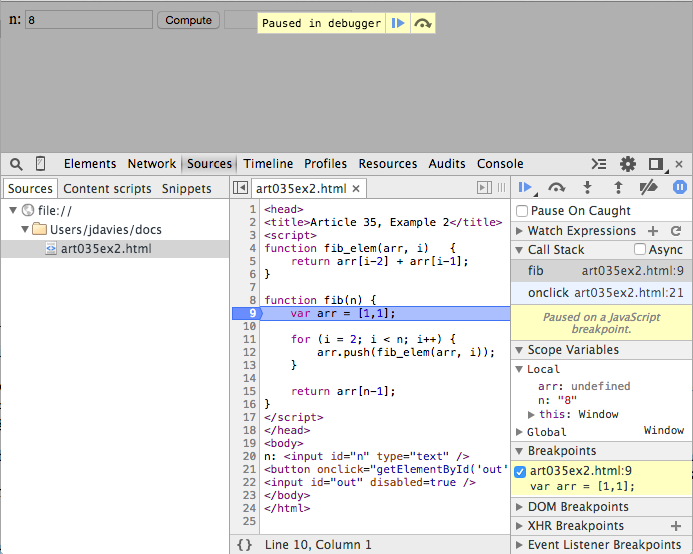
Figure 4: paused inside a function
Notice the program status area to the right of the source code listing. It consists of 7 headers
that can be expanded or collapsed individually: Watch Expressions,
Call Stack, Scope Variables, Breakpoints,
DOM Breakpoints, XHR Breakpoints, and
Event Listener Breakpoints. This area is responsible for giving you a view of
what's going on in the Javascript "program" right now — that's why it was mostly
empty in figure 3, since the Javascript code wasn't running. In figure 4, it has a lot more
to tell you.
The
Scope variables header is itself split into two subsections in figure 4:
Local and Global. If you peek back at figure 2, you'll notice that
Example 1 showed one Global variable named Window, just as in figure 4.
This illustrates a peculiarity of Javascript (at least, as opposed to many other programming
languages like Java and C). A Local variable is a variable declared with the
Javascript keyword var. But as you may know, var is not required in
Javascript — you can legally declare a variable such as:
x = 2;
This is not a local variable and won't show up under the local variables list; instead,
it is appended as a property of the global scope, which is always defined and which there
is always exactly one of. Use the step over command to step down to line 11 to
see this in action — the loop index variable i is declared without the
var keyword, so it appears not as a local variable, but as a property of the global
variable as shown in figure 5.
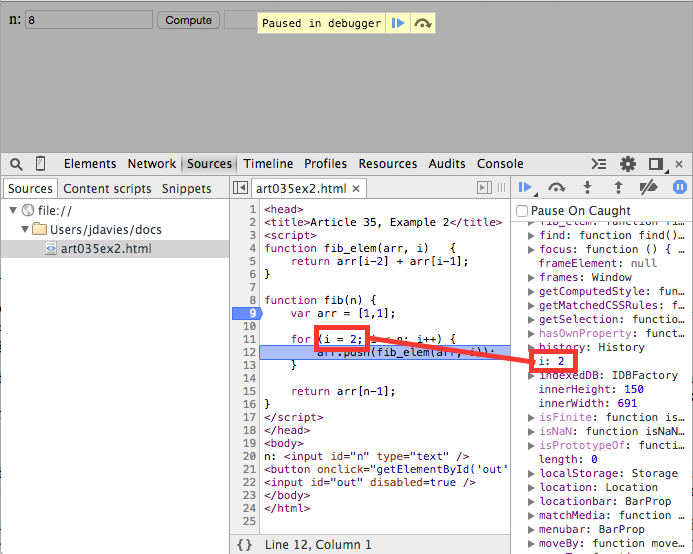
Figure 5: non-local variables become properties of the global scope
In this case, the global scope has a name and that name happens to be
Window. Global is always defined and, in client-side Javascript, always an instance
of "Window". Figure 4 shows an additional local variable n — parameters
passed to functions always become local variables.
Now, click step in and you'll jump into the fib_elem function, shown
in figure 6. Observe that the Call Stack grew by one entry; each time a function is called,
the call stack keeps track of where the call was made and keeps a reference to it. Here you can
now see that (at this point in the execution), fib_elem was called by fib which was initially called by
onclick. Click on the fib invocation in the call stack and you can see
what n was when that level of the call stack was active. In
addition, the source code listing highlights the line that made the original function call.
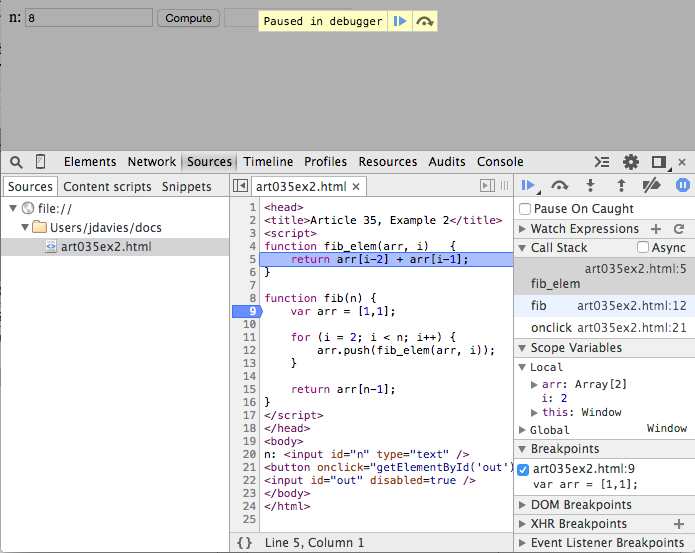
Figure 6: Peeking back up the call stack
That's not where the code actually is, though; if you were to click step over, you'd
return to the current level on the call stack. Before you do, though, you can actually peek
further back up the stack, to the "onclick" call that started the whole thing, as shown in figure
7.
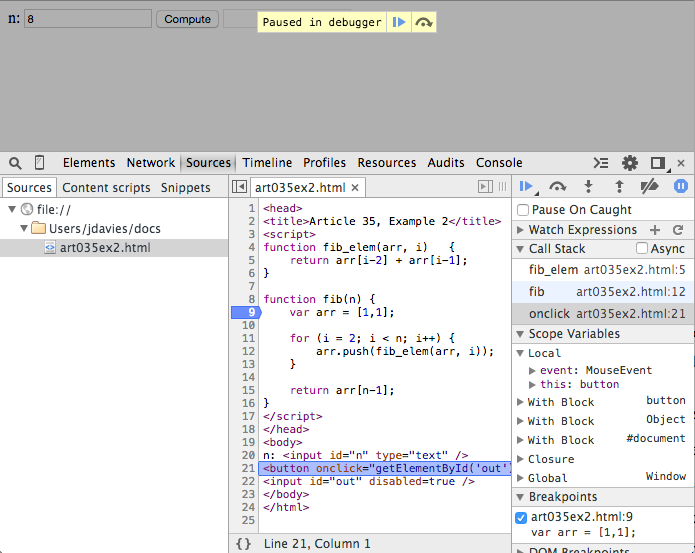
Figure 7: onclick handler
Here you can see that in this context, there were two local variables: event and
this. Here, though, the Scope Variables shows that there's a lot more
going on — there are three With blocks and a Closure that are
inserted by the Javascript runtime (i.e. Chrome itself). If you look at the source for example
2, you see that the button handler is declared as:
the function call
<button onclick="getElementById('out').value = fib(getElementById('n').value);">Compute</button>
getElementById is not global in Javascript — it's a method
of the Document object. So how does this code actually work? The with
block creates an implicit reference to #document that allows functions on
document to be called implicitly. Click the step out button to return
back to the original fib call.
The button to the right of the step out disables breakpoints so that the debugger
doesn't stop when they're hit, but leaves them in place so you can easily reactivate them.
Event Listener Breakpoints
So far, this is pretty boilerplate source-code debugger stuff; if you've used any other IDE
tool like Eclipse, Visual C++ (or even GDB), this should be old hat to you and even if you haven't,
you can almost definitely see the utility immediately. There are a few extensions, though, that
are fairly specific to Javascript execution, particularly in a browser. For instance, I showed
you in figure 7 how you can walk up the stacktrace to the browser-level action that triggered
a Javascript handler; but what if I had coded that handler in such a way that it didn't call a function in the source code?
What if I wanted to actually pause in the onclick handler itself? You might think
you could just set a breakpoint on line 21, where the onclick handler is declared.
And while
Chrome will dutifully put a breakpoint icon next to line 21 to make you think that it will stop
there when that line is executed (i.e. the button is clicked), the browser just sails past it.
This is where Event Listener Breakpoints come in handy. If you expand the
Event Listener Breakpoints header in the debugger, you'll see a categorized list
of every action that client-side Javascript can attach handlers to. In this case, the one
you're interested in is under Mouse — specifically, the click
handler. Figure 8 shows the click handler being invoked for the button click
from example 2. The scope variables section is the same as it was in figure 7,
but this time the call stack only shows one level, since the top-level handler hasn't made
any invocations yet. It's important to recognize that the event listener breakpoints only
break if you have a listener on the event in question — for example, the input boxes
can have click events set on them, but if your code didn't attach a listener to them, the
debugger won't break. It will break whether you used an HTML on attribute as I
did in Example 2, or a more modern:
or even a jQuery event handler (unfortunately, in the latter case, you'll be dropped into the
jQuery runtime).
document.getElementById("n").addEventListener("click", function() { alert("clicked"); });
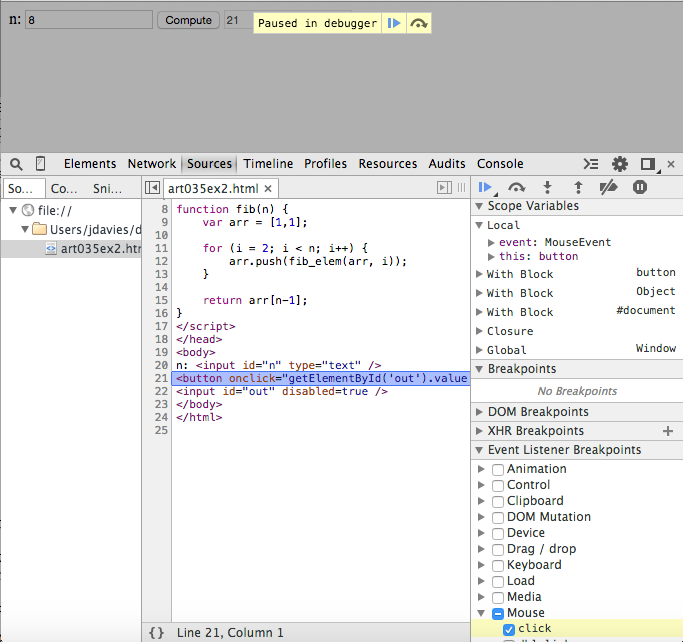
Figure 8: onclick handler breakpoint
Pause on Exceptions
I've talked about five of the six action buttons at the top of the program status area:
pause/play, step over, step in, step out and disable breakpoints. The last one is
Pause on Exceptions. Example 3 invokes the single
line of Javascript:
which will cause Chrome to throw a
window.nonexistent.call();
TypeError since I tried to call a function on
the nonexistent window property nonexistent. However, if you load the page, you
won't see any indication that anything went wrong. Since Javascript halts execution on an error,
though, the code below this line will never be invoked, leaving you to wonder what was
wrong with your page. Clicking the pause on exceptions as shown in figure 9 at least lets you
see what went wrong, although you can't recover from it. The description of the error itself
appears a yellow area underneath the control toolbar. Pausing on exceptions is almost always
useful, and I leave it active almost all the time.
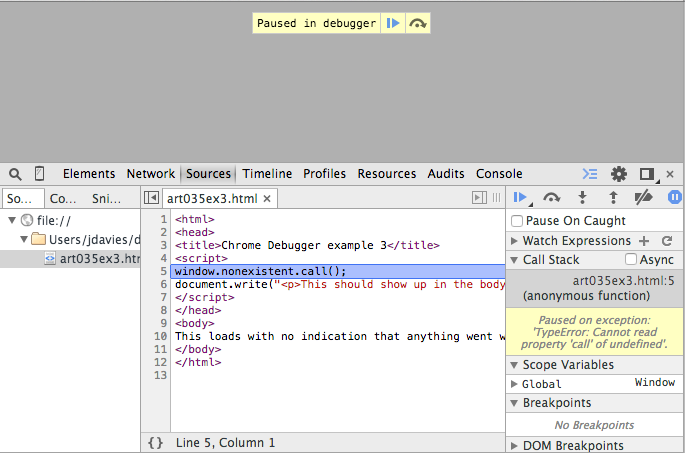
Figure 9: pausing on exceptions
You may have noticed that, when you activated Pause on Exceptions a new checkbox
appeared labeled Pause on Caught. This checkbox doesn't seem to change the behavior
of the page and for example 3, it doesn't. However, in Example 4,
I've surrounded the erroneous call with a well-intentioned-seeming try/catch block:
In some ways, though, this is even worse, because the part outside the
try	{
	window.nonexistent.call();
} catch (e)	{
	console.log("Oops, nonexistent was nonexistent");
}
try handler
did run, so you really don't have any indication that anything was wrong unless you
happen to look at the console. If you click the Pause on Caught checkbox, though,
you'll be notified that you had a problem as soon as it happens.
Watch Expressions
Watch Expressions toward the top, allows you to input an expression that will
be evaluated every time the debugger pauses, including after the page has fully rendered. If
the expression is meaningful relative to the Scope Variables you'll see its value;
if not, Chrome will just report that it's <not available>. You never need
watch variables — you can always determine variable values from the Scope Variables,
but watch variables do come in handy from time to time over the course of a long debugging session.
Breakpoints
So far, I've discussed the buttons along the top, the Watch Expressions,
Call Stack and Scope Variables. The remaining four debugger tool
headings — Breakpoints, DOM Breakpoints, XHR Breakpoints and Event Listener Breakpoints — all show you lists of breakpoints that you have set. The simplest is the first, just labelled
Breakpoints — it shows you where in your source code you have set a line-level
breakpoint. If the Javascript execution engine reaches any of these lines, the engine will
pause and the debugger tools will become active as shown in figure 2. You can uncheck the
check box next to the breakpoint and that will cause Chrome to ignore this breakpoint until
you re-check it; helpful if you have to set a breakpoint inside a loop for any reason. The
Breakpoints are lists of any breakpoint in any source file that was loaded
by this page.
Chrome will also do its best to keep track of breakpoints that you've set and reload them when you re-open the page at a later time. This means that if you have two or more pages that share a Javascript source file, the breakpoints you set in one page will still be active when the other is loaded. However, if you modify the source file outside of Chrome, the breakpoint will stay on the same line that it was one when you created it initially — even if that logical line has moved up or down in the source file. What if you delete the line entirely? In this case, the breakpoint will still remain, unreachable, until you decide to remove it or extend the source code file to include code at that line in the future.
DOM Breakpoints
What about DOM Breakpoints? If you expand the disclosure triangle,
there doesn't appear to be any way to add one. Instead, as shown in figure 10 below, the only
way to create a DOM Breakpoint is to navigate over to the Elements
tab, right click on a DOM element (i.e. one of your HTML tags) and select one of the
Break on... options. As you can see, there aren't very many.
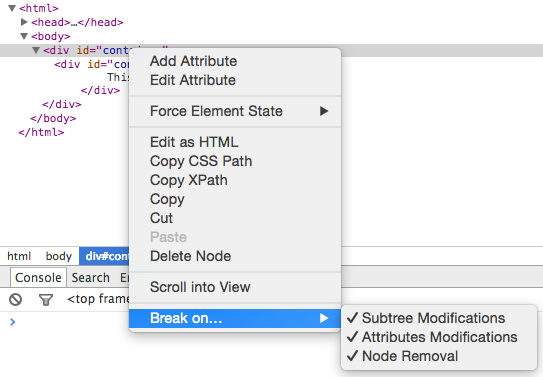
Figure 10: DOM Breakpoints
XHR Breakpoints
Below DOM Breakpoints are XHR Breakpoints, the last remaining
subheading of the debugger tools.
XHR is shorthand for XMLHttpRequest, which
is the workhorse of the development pattern called AJAX. AJAX itself is
an acronym for "Asynchronous Javascript and XML", and as such, is initiated by an
XMLHttpRequest object. The "X" both at the end of AJAX as well as in the
first word of XMLHttpRequest are fairly misleading as AJAX does not actually require
XML at all. In most cases these days, AJAX is done using the Javascript-friendlier JSON notation instead.
Clicking the "+" icon next to XHR Breakpoints as shown in figure 11 will allow you
to break on any XMLHttpRequest or only one that contains a specified substring in its URL.
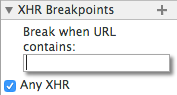
Figure 11: XHR Breakpoints
Example 5 is a simple "dynamic" web page that loads its content
through an XMLHttpRequest invocation. If you've enabled Break on any XHR, the
script will pause as shown in figure 12 before the send call. This is most useful
if the page does a lot of dynamic update based on AJAX calls and you need to see what the page
looks like before the call returns.
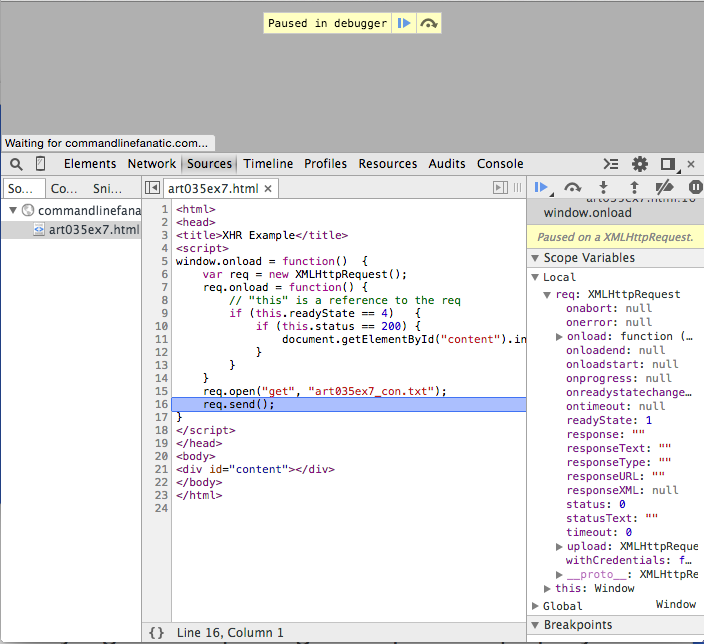
Figure 12: Break on XHR
Async call stack
Example 5 is also useful to demonstrate the Async checkbox next to the
Call Stack that I glossed over previously. "Async" is short for "Asynchronous"
(the first A in the acronym AJAX) and is another term for
multi-threaded. Although Javascript doesn't offer a facility for creating or
managing multiple threads of execution, the browser can do so on your behalf as in the case of
an XMLHttpRequest send() call. As demonstrated in figure 13, if the
Async checkbox is enabled, you'll be notified where, in the calling thread, this
invocation originated.
Some other sources of asynchronous calls in Javascript come from setTimeout and
newer HTML5 features like Web Workers.
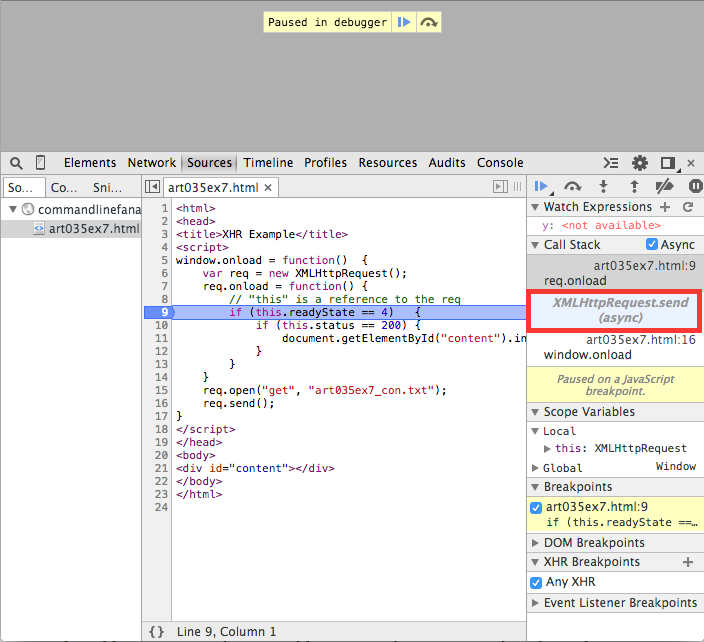
Figure 13: Async call stack
Script sources
All of the previous examples have been pretty simplistic, to demonstrate a single aspect Chrome's
debugger tools. However, most web interfaces are much more complex, and Chrome has a lot of
support for taking this into account. Figure 14 shows the source list when you
load Amazon's home page. Here you see that all of the source
files that were loaded are organized by domain and path. This view can be particularly helpful
when trying to diagnose cross-domain scripting and cookie-sharing issues. The sources list is
updated dynamically so that when, as is often the case, scripts load other scripts, you can see
that they're there.
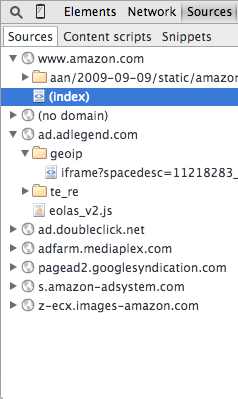
Figure 14: Amazon.com's sources list
Although the sources view shows you from which domain and path the script was loaded, it doesn't
tell you which source file was responsible for bringing it into scope. You may be surprised one
day to find, for instance, that EXT-JS has suddenly been brought into your web page, causing
strange conflicts. You probably suspect that an advertiser is responsible, but which one? All
you can tell from the Source tab is that it was loaded from the domain
www.sencha.com. Chrome does offer you a way to trace the script back to its
ultimate source — right click on the script under Sources and select
Reveal in Network Panel. That will take you to the Network Tab
which has a column for the "Initiator" of each web artifact. However, you'll only see the
Reveal in network panel option if the chrome debugger tools were opened when you
loaded the page in the first place; you may have to open the debugger tools and reload the page
to see it.
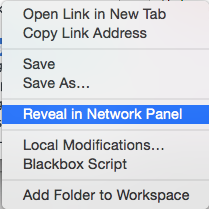
Figure 15: Reveal in Network Panel
Minification and source maps
Most of the time, though, Javascript isn't deployed like the examples I've shown so far, with
embedded <script> tags — instead, it's separated out into external
source files and usually minified before being deployed into production.
Example 6 is a minified version of example 2's Fibonacci computation,
after having run the Javascript through
UglifyJS. Although compression is hardly
worthwhile for this simple example, it demonstrates how compressors affect more complex pages.
If you load the example, you see that the whole Javascript source has been reduced to a single
line as shown in figure 16.
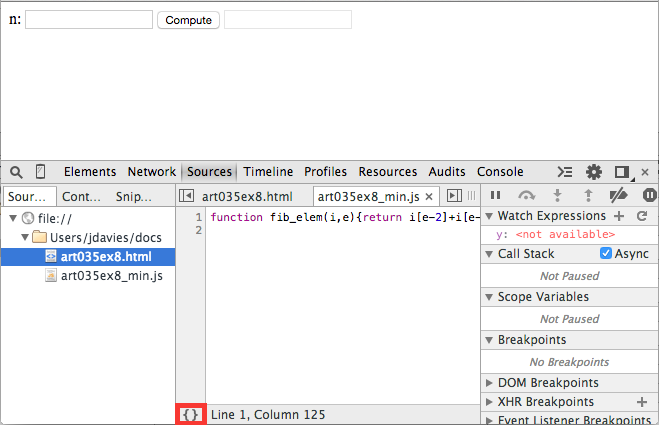
Figure 16: Minified/compressed source file
All source files are subject to "pretty-printing" if you click the Format icon in
the lower-left corner. When you do, Chrome attempts to follow a set of readability rules to
make the source more human-friendly as shown in figure 17. Notice that when you click it, the
button disappears and the tab reminds you that it's "formatted". If you want to see the original,
just close the formatted tab.
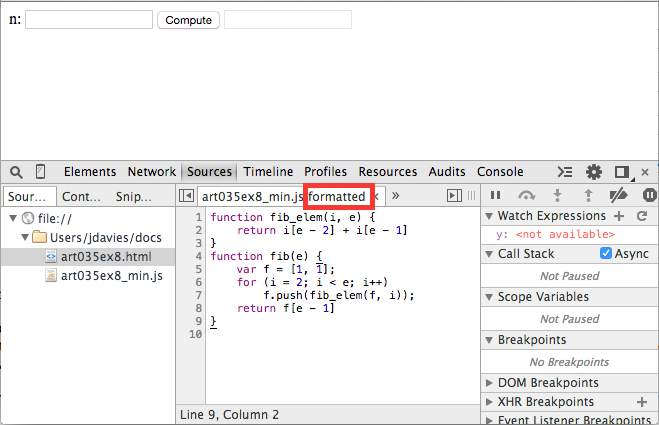
Figure 17: Semi-unminified Javascript
However, if you compare the pretty printed Javascript with the original javascript source file,
you'll see that there are still quite a few differences; UglifyJS renamed all of the local variables
to nondescript i and e. Minifying is done partly to save network bandwidth but also as a form of obfuscation
to make the job of a would-be hacker just a little bit harder than it otherwise might be.
And when I say "a little bit harder" I really mean "a little" bit. Don't rely on code obfuscation to secure your site — if your site wouldn't be secure without obfuscation, it's not secure with it, either.
If you have a problem that you can only reproduce on your live site (perish the thought), and you need to troubleshoot it using Chrome's debugging tools, you can always load the live site with its minified code, pretty print it, and try to step through that way. I've found, though, that breakpoints aren't nearly as reliable with pretty-printed code, and it is helpful to see the meaningful variable names that you spent so much time thinking up when you were writing the code in the first place when trying to trace through why something isn't working. In this case, you don't have to install the development source code in production just to pinpoint a problem; Chrome actually allows you to replace the live code "in place" with the original source code by using a source map.
The source map option only appears on the original unformatted view; close the
formatted tab if it's open, right click on the source area (not the name of the file on the
left) and select Add source map as shown in figure 18.
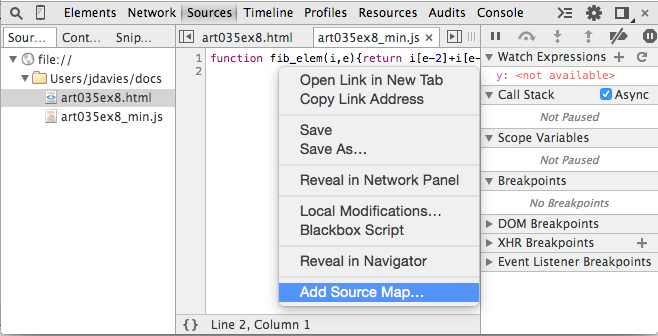
Figure 18: Add source map
The pop-up shown in figure 19 will prompt you to input the path to your source map; this can
be a public URL but will most likely be a file artifact on your local system — if so,
you'll have to provide a full file URL such as file:///Users/jdavies/Workspace/site/art05ex9_src.js.
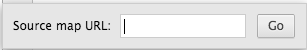
Figure 19: Locate source map
Once you do, the original will appear, and you can interact with it just as if you had loaded the page from your local system — in many cases, when you use AJAX, this can end up being the only way to track down an issue.
So how did I get this source map? There's a published standard,
but almost all minifiers will create one for you if you ask. The minified code in example 8
was generated from the source file art035ex8.js:
via:
function fib_elem(arr, i)	{
	return arr[i-2] + arr[i-1];
}

function fib(n)	{
	var arr = [1,1];

	for (i = 2; i < n; i++)	{
		arr.push(fib_elem(arr, i));
	}

	return arr[n-1];
}
Which produced the "uglified" art035ex8_min.js:
$ uglifyjs -m -c --source-map art035ex8_src.js art035ex8.js > art035ex8_min.js
The generated source map looks like:
function fib_elem(i,e){return i[e-2]+i[e-1]}function fib(e){var f=[1,1];for(i=2;i<e;i++)f.push(fib_elem(f,i));return f[e-1]}
As you can see, the source map is just a standard JSON file. All of its elements are pretty
straightforward, until we get down to the
{
	"version":3,
	"sources": [ "art035ex8.js" ],
	"names": ["fib_elem","arr","i","fib","n","push"],
	"mappings":"AAAA,QAASA,UAASC,EAAKC,GACtB,MAAOD,GAAIC,
		EAAE,GAAKD,EAAIC,EAAE,GAGzB,QAASC,KAAIC,GACZ,GAAIH,IAAO,
		EAAE,EAEb,KAAKC,EAAI,EAAGA,EAAIE,EAAGF,IAClBD,EAAII,KAAKL,
		SAASC,EAAKC,GAGxB,OAAOD,GAAIG,EAAE"
}
mapping section. The mappings section is
a list of where in the minified/"uglified" source the corresponding invocation can be found in
the original source. In the source map above, you can see that there are 33 comma-separated
values, which represent a compacted mapping of the identifiers in the generated code back to
the original code so that events that occur in the generated/minified code can be traced back
to the original and debugged accordingly.
In fact, Chrome is so source-map aware that if the minified code includes a comment in the form:
Chrome will process the comment as an execution instruction and load the source map automatically
from the given URL — in this case a local file. UglifyJS will produce such a comment for
you automatically (I deleted in manually from example 6), but unless you override it, it
will be the direct path on your local file system to the generated source map. You can override
it with a networked URL where you plan to install the source map; I don't find this to be very
useful since I then have to keep the installed source map up-to-date with each new build, but if
this sounds useful to you, have a look at the uglifyJS documentation.
//# sourceMappingURL=art035ex6_src.js
Add a comment:
Completely off-topic or spam comments will be removed at the discretion of the moderator.
You may preserve formatting (e.g. a code sample) by indenting with four spaces preceding the formatted line(s)